In data-driven fundraising, how do we create tools that help fundraisers assess their portfolios and allow leadership to forecast gift pipelines as accurately as possible? How do we develop tools that help fundraisers do their jobs more effectively without making them feel penalized?

These two questions are at the heart of the conversation I had recently with team members at the University of Cincinnati Foundation:
- Carrie White, Vice President of Technology, Information and Philanthropic Strategy
- Betsy Schmidt-Gullet, Senior Director of Prospect Development
- Aubrey Wilson, Director of Reporting & Analytics
(Access their bios at the end of this post.)
Specifically, I spoke with Carrie, Betsy, and Aubrey to learn more about PAM & DWIGHT.

No, we weren’t chatting about The Office, but two internal tools (named after these beloved characters) that the Foundation created to help them analyze their data, drive results, and strategically partner throughout the organization.
PAM = Portfolio Activity Measure
DWIGHT = Forecasting Discounting Methodology
Below is our conversation, edited for clarity.
A Tool To Improve Fundraiser-Prospective Donor Relationships
Caitlin Scarano: Can you tell me the story of PAM and DWIGHT? How were the tools formed? Who was at the table?
Betsy: PAM, which stands for Portfolio Activity Measure, came before DWIGHT. A few years ago, we went through a process to narrow prospect manager’s portfolios to a smaller size, to ensure that we were being more effective and keeping those relationships active.
But when we looked at the actual data, we saw that, even though the portfolios were smaller, they weren’t as active as we would like. There were still a considerable number of prospects that their prospect managers weren’t visiting. So PAM grew out of a joint effort between prospect development and the leads of the fundraisers, the AVP team for frontline fundraisers, to address the following: What do we want to see happen regularly within a fundraiser-prospective donor relationship to ensure that the relationship is moving forward?
We also wanted to determine how we track those activities and display them in an easy-to-digest form. This is how PAM was created. Through the partnership with the fundraiser supervisors, we determined what we thought the bare minimum should be for a prospect relationship.
Then in 2019, we met with that same group to talk through, “Okay, that was our bare minimum. Now that we’ve had the PAM toolkit for over a year and we’ve met our threshold of 80% active [prospect relations], do we need to change it or modify it? What have we learned during the first year?”
When we reviewed the data, we realized that in most cases qe were waiting a year after qualifying a new prospect before we reached out and actively engaged them. So we met for several months and designed a PAM 2.0 version, which launched in the fall of 2020.
PAM moved from measuring the bare minimum of what we expect for a prospect relationship to measuring and setting the standard of keeping these relationships active and ensuring we’re really moving towards a strategy closure. Whether that’s solicitation or stewardship, we’re looking at the overall institutional relationship with that prospect.
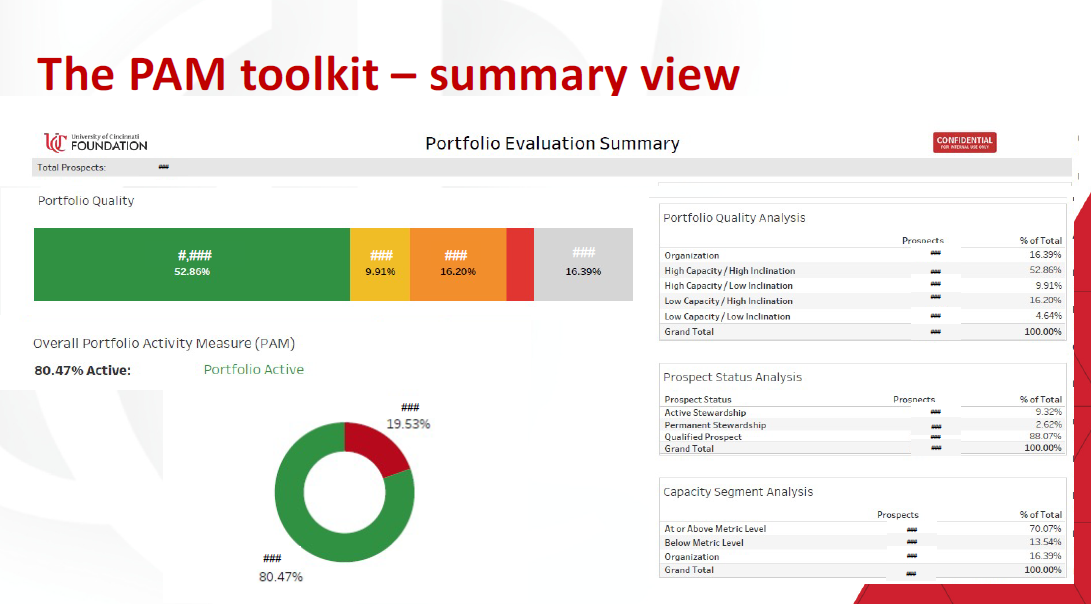
Source: University of Cincinnati Foundation; Image description: Landing page of PAM, designed to show overall health of all portfolios (mostly aggregated data)
Carrie: It is important to know that a lot of this was assumed to be known as activity that should be happening [in the fundraiser-prospect relationship], but the fundraisers had to go to several different places (reports, CRMs, etc.) in order to determine if they’d visited a specific prospect and taken certain steps in that relationship.
We really wanted to provide them with a dashboard so they could make sure they were on track, as well as give their supervisors insight into what’s going on with a specific prospect without having to look in several different places. This was meant to be a carrot, as Betsy often says, not the stick.
In addition, we want to note that this tool started with Betsy’s predecessor in her role, and then Betsy took it to the 2.0, along with Aubrey. So many different people deserve credit.
Caitlin: What does PAM measure exactly? What are the factors and how are they measured?
Betsy: There are four fundamental pieces to PAM:
- First is that prospects are being visited regularly. Considering COVID, we count visits broadly, including electronic meetings.
- Second is what we call a “strategic interaction,” which is defined by a two-way interaction between the prospect and a fundraiser that’s moving forward a strategy. Sending an email isn’t necessarily strategic, but having a conversation where you’re discussing their interest or their gift, we’d categorize those as strategic. A strategic interaction is required once a quarter for managed prospects and once a year for organizations or stewardship prospects.
- The third one is that the fundraiser has to have a “plan on record,” which indicates to us that the fundraiser has thought through what they want to happen.
- The fourth piece is what we call “ask on track.” It is the most complicated and can be confusing to frontline fundraisers, but the “ask on track” is meant to move prospects through a three-year solicitation cycle. So this tracks many different data points to see if, from those data points, it looks like our office is moving this prospect along in a gift conversation within a three-year window, unless they’re in stewardship status.
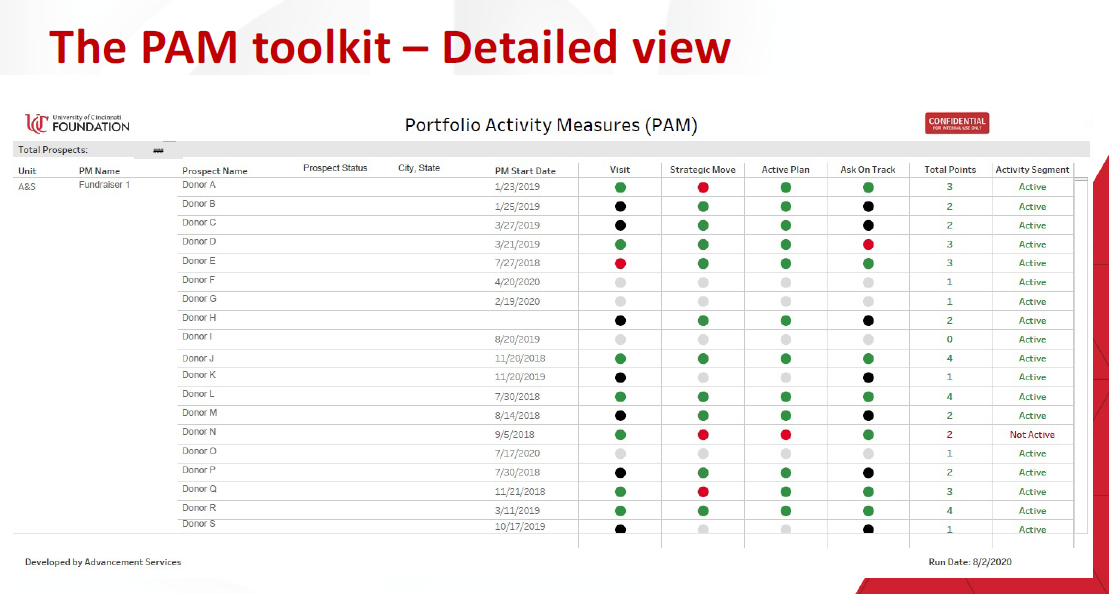
Source: University of Cincinnati Foundation; Image description: This detailed view of the PAM toolkit shows individual project data, assessed across four different areas (Visit, Strategic Move, Action Plan, and Ask on Track) in a status of red, green, black, or gray. This detailed view provides a quick visual analysis of the health of a prospect.
Caitlin: With the “ask on track,” can you give me an example of one or two of the data points that are key there?
Betsy: For our fundraisers, our goal is once they qualify a prospect, they have a year to get to know them and, in our definition of a qualification, the fundraiser thinks they’ll be able to solicit within a three-year window. With “ask on track,” we’re looking at the qualification date, the plan add date, and—considering different factors compared to the opportunity or solicitation date—the time range involved. If a gift is closed, we allow an additional year for the fundraiser to steward that gift before we start looking for a new plan or upcoming solicitation.
We’ve tried to build in time frames to allow for natural relationship building and not dictate that fundraisers have to do these exact things at these exact times. But we want to ensure that the process is moving and the relationship doesn’t become stale or stagnant.
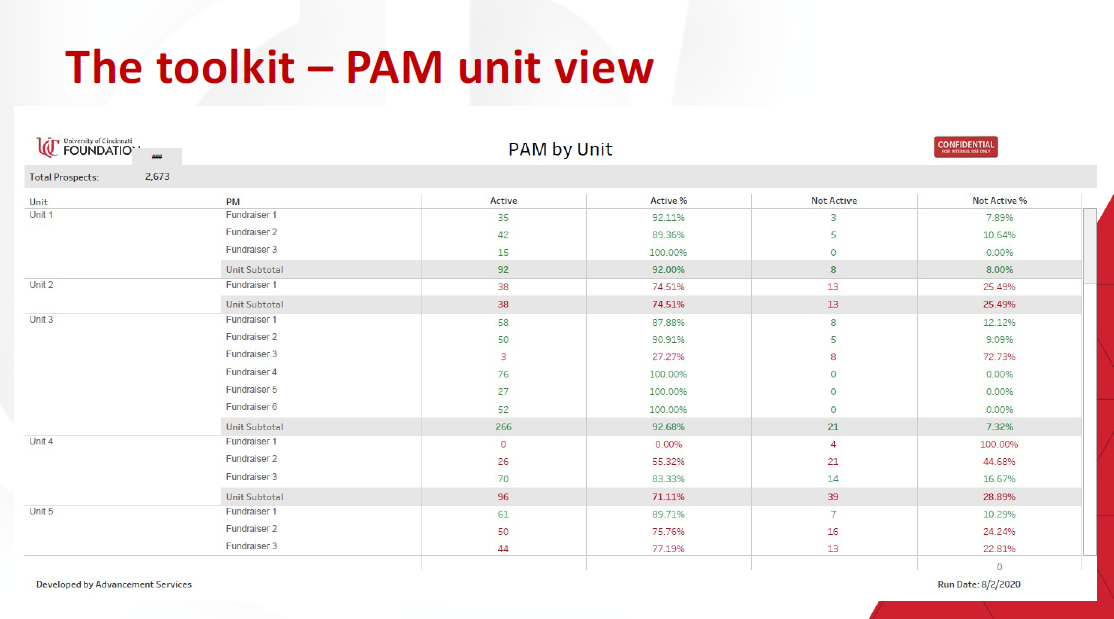
Source: University of Cincinnati Foundation; Image description: This unit view of the PAM toolkit breaks down the pie chart from the dashboard/opening page view and displays which prospects are active vs. inactive and breaks this down by units. Here, users can see the overall health of the entire prospect pool and dive in to see the individual health of each prospect relationship and individual health of each unit.
Creating An Accurate Fundraising Prospect Pipeline
Caitlin: Could you walk me through the DWIGHT tool in the same way, including what factors go into it?
Carrie: DWIGHT came out of the need to have an accurate forecast of our pipeline and what gifts we expected to close. We used to simply discount our pipeline by considering the amount of time it was going to take to close a gift and the amount of the gift.
We realized we needed to look at the health of the actual ask along with other factors from our data. Instead of taking everything in mass, we looked at the individual gift and applied methodology based on the data that we were seeing within our system. For example, Aubrey found that if an ask moves more than five times, it’s 50% less likely to close.
It is important to note that this is what is happening at the University of Cincinnati. In reference to DWIGHT, we encourage practitioners at other institutions to scrub their own data and see what likelihoods happen within their own environment.
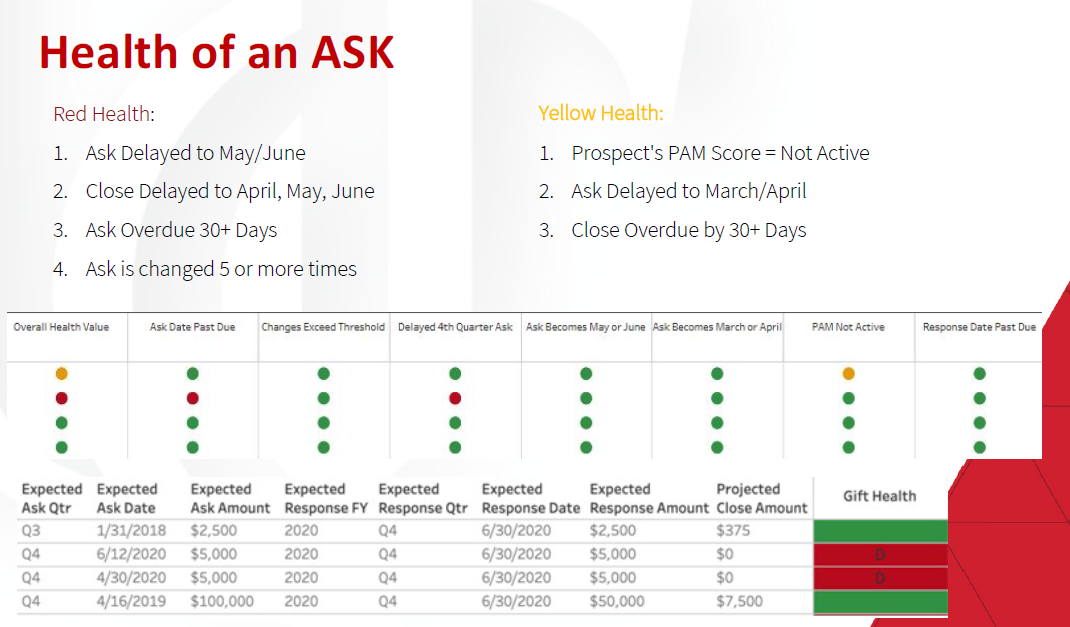
Source: University of Cincinnati Foundation; Image description: This view of DWIGHT shows the health of an ask through different, specific criteria, such as Expected Ask Date and Expected Response Rate and assigning a color (green, yellow, or red; each with a different discounting method). The goal of this view is to give the management team the ability to see what they need to see, especially through filtering by team, unit, or individual fundraiser.
Fundraising Metrics: Using The Data
Caitlin: Were these tools used solely to help track the relationships and predict the timelines of the gifts, or were they also used as assessments of a fundraiser’s performance or progress?
Betsy: When we look at the actual PAM data, it categorizes activities into red or green. I think intuitively we’ve been conditioned to think that when we see red that’s bad and that green is good. Within our department, we’ve had ongoing conversations about whether or not the PAM score should become a formal metric for our fundraisers. So far we have leaned away from using it in that way.
One reason is that we had a really good early adoption of PAM by our fundraisers. But I think the changes to PAM in the second version may have been viewed as making it stricter in the eyes of some fundraisers, especially during the time of COVID, when they already felt like their work was extra difficult.
Making something a metric encourages its adoption in some ways because people have to use it, but in other ways, it makes people even more reluctant to buy into the philosophy behind it. So, we’ve decided to not use PAM as a metric; instead, it is a tool that the fundraisers’ supervisors utilize to have a sense of what’s going on.
We discuss the tool regularly within prospect development. We talk about it in every monthly portfolio review we have with a fundraiser. But we’ve really stopped using the word PAM, because, whether or not a fundraiser has bought into the idea of PAM, these are important things to be tracking to make sure that our donor and prospects relationships are staying active and progressing.
One of the requests from the development team after PAM went live was for us to add an additional page where it broke out the PAM score by each unit and by each fundraiser. We had originally built it as a one-person end-user tool where a fundraiser could go and see what their portfolio looked like. It has evolved into a tool that supervisors are using to hold people accountable, but without making it a formal metric.
We’re trying to use it to start conversations such as, “Look, the data is showing me that maybe a certain person isn’t a realistic prospect because the activities are red all the way across.” Or, “Maybe this is someone that I’m not the right fundraiser to engage with.” Or, “Maybe I kind of forgot about this prospect because they’re in a region that I don’t travel to enough.” There are so many discussions that PAM can lead to. We’ve tried to focus on the questions that the data is presenting to us instead of the actual PAM score.
Carrie: As our president puts it, “It’s more important what PAM can do for you than being told you have to get your PAM score up.” How can it be an aid to help you do your work with less friction?
Caitlin: How did the training or the rollout process go for each tool? Have you used any incentives or ways of getting the fundraisers to use the tools and update them in a timely manner?
Betsy: Training for the initial PAM tool was rolled out with our prospect management policy during our goal-setting process in the spring of 2019. For PAM 2.0, we did virtual training for all fundraisers in fall 2020. We had slideshows and shared the recording. We followed up by meeting with the fundraisers at least once a month.
Even though we did the broad training, some people were still trying to understand their own score or why it had changed. So, for the second version of PAM, our training became more about working one-on-one with fundraisers to help them understand what it meant and what was different.
During the same time in 2019, there was a big push to reevaluate how we were engaging certain regional markets in our fundraising efforts, which reinforced the need for PAM in that first year because we were having meetings about particular markets.
If we took a close look at prospects that were within those markets or regions but indicated inactive by PAM, we could talk through how our regional gift officers could be helpful in keeping those relationships active. That was when we saw the biggest increases in our PAM scores. Unfortunately, I think the realities of COVID and remote work caused the scores to start declining a bit after that.
Carrie: As for DWIGHT, we’ve kept that at the leadership team level, because, after the rollout of PAM, we didn’t want to confuse people with how many metrics we had at once. We also had a philosophical conversation about how you keep fundraisers motivated and driving towards an ask. For example, if all of a sudden a fundraiser has a million-dollar gift discounted to $500,000 because of when it is expected to close or some other factors, that can be demoralizing for the fundraiser.
We wanted to be able to keep the fundraisers’ optimism alive, but we also want to be able to assess the reality of what we thought the pipeline was going to be able to achieve.
We made the deliberate choice to keep DWIGHT at the leadership table so that we could intervene when appropriate if we saw a large ask starting to look like it may not close, but not have this information be so public.
We needed to keep the spirit of fighting to the end alive in our fundraisers and not have the discounting, because it does get rather steep as we get closer to the end of the year, be a detriment towards them actually closing the gift or not.
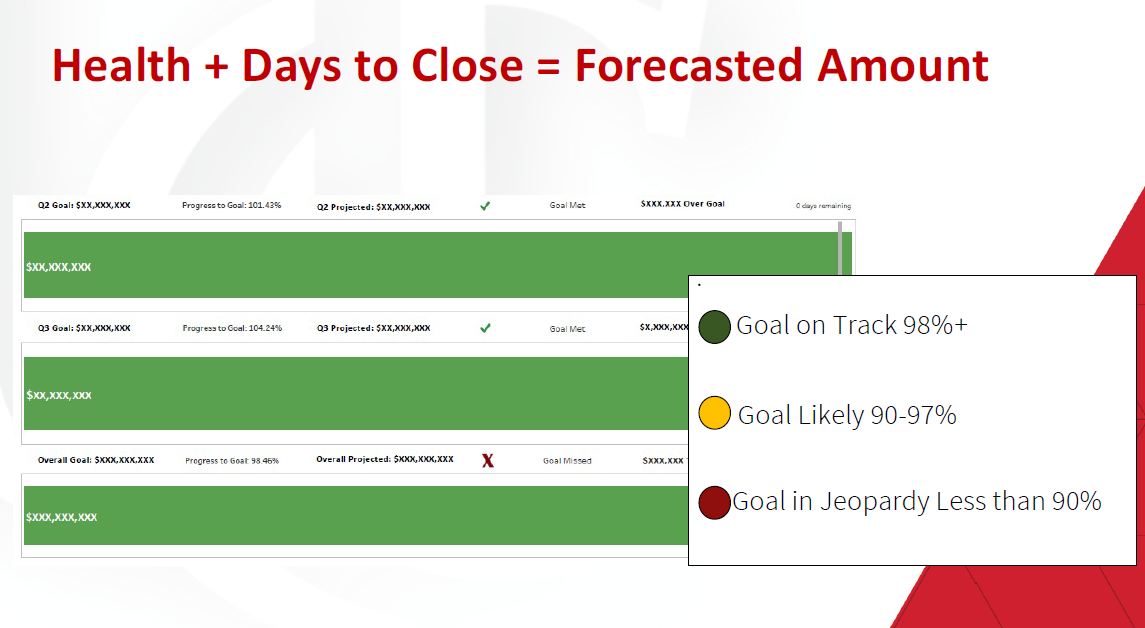
Source: University of Cincinnati Foundation; Image description: Using a formula that looks at the health of the gift and when it is expected to close, this view provides a projected close amount for the gift, so the leadership team can tell if they will be above or below their projected goal(s). This view can show unit or organization-wide goals.
Betsy: I think we learned our lesson with PAM that, even though it was meant to be a helpful tool, some people saw it as a judgment. To Carrie’s point, within DWIGHT, there is a “health of the ask” consideration, or “a health of the gift,” and so we didn’t want people to interpret our view of is a gift going to close within a certain timeframe as a judgment of the overall value of whether this gift good or bad.
We didn’t want them to equate the assessment of if it might close within a certain timeframe with the likelihood of it ever closing. It is possible that some fundraisers would miss the timeframe of the DWIGHT tool and just interpret it as saying this gift isn’t going to work. But, even with DWIGHT, you don’t really know what’s going on with a certain gift or fundraiser-prospect relationship. There’s more than the data. How we’re looking at the data is often different than how the fundraisers are looking at it.
Caitlin: Were there other major challenges or changes or ways you had to pivot?
Carrie: We were very fortunate to have an in-house expert and data analyst that was able to produce these tools. When we think about this body of work, it cannot be understated how much time and investment in talent was brought forth by Aubrey. There were many calculations and recalculations.
Aubrey: We initially spent several months looking at the data and then scrubbing fifteen or sixteen different ways to determine what points were causing our pain. What we were seeing were negative factors for gifts that didn’t close or were canceled or rejected by the prospect. Once we had those pieces, the big challenge was determining how we wanted to build our solution, because we have so many different tools.
As Carrie mentioned earlier, so much of this information was found in those various tools separately. We had a frank discussion about where we wanted the solution to live and how we were going to build it. These tools are accessed through dashboards we built in Tableau. We chose Tableau partially for ease of build (it is much easier to build and deploy something there) but also for ease of use because Tableau is so easily accessible compared to some of the other systems.
[At this point, Betsy had to exit the call for another meeting.]
The Results: Data-Driven Fundraising
Caitlin: I understand that it’s early in the process for these tools, but can you say what results you’ve seen so far, whether that’s in your ability to forecast or in the relationship between the fundraisers and the prospect researchers?
Carrie: We’ve had some phenomenal results. Our ability to forecast has improved. Within six weeks of closing the pipeline last year, we were at about 98% accuracy.
I had a leader once say to me, “You can’t manage what you can’t see.” In advancement, we often have so much information in so many places. We have these huge CRM systems and then we build eight thousand Tableau reports, but where do we really need to focus? I think back to what Betsy was saying: these tools allow the appropriate audience to focus in the right place.
When it comes to DWIGHT, we reflect weekly in the lead team meeting on: What are we seeing? What should we celebrate? Where can we intervene or lend a hand? More than anything, these tools are about helping us adopt that second language of natural, data-driven fundraising and culture within our organization.
It balances the art and science of fundraising. So often we hear from fundraisers, “Yes, this gift is going to close,” which is the healthy optimism we want from them. But also, we want them to explain, “Here’s what the data is telling us.” How do we marry those two perspectives so that we have a realistic view of where we think we’re going to wind up and how portfolios are looking?
Fundraisers have plenty of metrics. It’s not our job to employ another metric. Our job is to remove the friction between them and the system to ensure they can do their job easily and that they know where to focus. That’s where we spend our time and attention within the TIPS team—to make sure that frictionless fundraising can happen.
Caitlin: Do you have any ideas for changes or improvements you’d like to make to the tools or how they’re implemented and used?
Aubrey: Today is the last day of the fiscal year. The next step for us is to look at both reports, considering every gift that did close versus what did not close or was rejected. Then we’ll reevaluate all of our points in these tools and make sure that we kept that same accuracy we saw last year. If we didn’t, we have to reevaluate those gift-specific metrics and determine if we need to update our formulas.
This assessment will be an ongoing process for years to come. Each time we finish a fiscal year, we want to ask: did we stay accurate? If we did lose accuracy, how did that happen? We’ll also make sure that we keep those formulas updated and work towards whatever the new normal becomes for fundraising post-COVID. So many things have shifted in the last sixteen months and we have to make sure we’re staying agile enough to forecast for those changes.
How Other Institutions Can Achieve Similar Fundraising Metrics Benchmarks
Caitlin: These tools and this project sounds very specific to the culture and the data at the University of Cincinnati, but do you have any general tips for how other schools could create something like this for themselves?
Carrie: It is a common belief [in advancement offices] that the data’s not robust enough, not good enough, not long enough. But my advice is to just start. Start looking at what data points you can zero in on with the information that you already do have, knowing that it’s not going to be 100% perfect.
Ask yourself and your team: what are the things, the data points, that can start to point to the likelihood and success of a gift closure? Then ask, what do your fundraisers need to know? What do they need to have at their fingertips to make sure that a prospect is accurately engaged? Also, assess the tools you’re using in your office; where are those places that are causing those pain points and frustration?
Aubrey: Start from a data perspective, as Carrie said. It doesn’t matter how much data you have to start, look at what you have and see if you can identify any patterns or factors that seem to be jumping out at you. Then look at what you have versus what you’d like to have, in terms of data or tools. For example, for us, we built internal tables that could combine data into single places so we could have better access to it.
There are so many tools and programs out there that work as integrations to the various CRMs. So, try to find a tool or a person who could build a tool for you, that can access the information you’re looking for and then just keep growing. Our data grows exponentially every year. We cycle, cycle, cycle until we have a better idea of what’s going on.
Caitlin: There are so many data points that we can have on prospects and it does continue to grow. Do you feel like there’s such a thing as too much information? Or, because there’s so much information, it’s essential that we have these tools to know where to prioritize?
Carrie: There’s too much data. We can track shoe size, eye color, hair length, all of those things, if we really wanted to. But do those data points really tell us anything about the engagement of the donor? Say there is a correlation between shoe size and engagement of the donor—you still have to be able to prove that.
We could try to know everything about everybody, but then we’re crushed by the weight of our own output. We get paralyzed with even knowing where to look. How do we get to the point where we have solid, good core data, that we understand influences a relationship with a constituent, without being crushed by output? We’re not collecting superfluous information that really doesn’t tell us anything.
A reality we have to face in this country is that there’s this insatiable need for data—in fundraising in particular, but also in all industries. Think of this need for data as a train on a track going full steam and the other train on the other track coming in the opposite direction is the need for privacy. How are those two things going to intersect? What is important and ethical and right for us to know? These are questions we’re going to have to wrestle with in this industry sooner than we realize.
I want to be really clear. All of the data that we, the University of Cincinnati, have is publicly available information and information that donors have given to us. But, the reality is there’s a lot of public information out there. How do we think about that as we apply it to our methodology?
Caitlin: Yeah, that is an amazing metaphor for thinking about that tension between the demand for data and the need for privacy, and what’s going to happen. I think it is going to come to a head in the next few years in an intense way. […] For my final question, can you speak to the importance of building better understanding and collaboration between the research teams and the actual fundraisers?
Carrie: This goes back to the idea that an entire technology information and philanthropic strategy team is here to remove friction so that fundraisers can focus on exactly what it is that they need to do. We don’t need them to be really good at the technology to be credible fundraisers. What can we, as prospect research teams, do that adds value so that fundraisers can get out there, manage relationships, do all of the hard, heavy lifting that has to happen in order to close a gift, without technology being in the way?
This is why we keep coming back to that question, “What can PAM do for you?” Similarly, what can a Tableau report do for you? Whatever the tool is—how does it make life easier? How can we remove the friction between the fundraiser and the technology so they can do the other heavy lifting? Our job is to do this part for them.
Caitlin: I really appreciate your clarity explaining these tools and thank you all for taking the time to have this conversation!
Interviewee bios:

Carrie White
Carrie White is the Vice President of Technology, Information and Philanthropic Strategy at the University of Cincinnati Foundation, where she leads teams responsible for data management, gift processing, reporting & analytics, application support, IT infrastructure, and desktop & hardware support. During her tenure with the UC Foundation, Carrie has managed the Foundation’s conversion to and implementation of Blackbaud CRM and Tableau. Ms. White and her team have brought tools to advance the fundraising success of UCF while removing technological friction between solutions and end users.
As a departmental leader, Carrie is dynamic and detail oriented. She combines comprehensive experiences in advancement services, fundraising, strategic planning, analytics, and data management to focus and guide her team. Her professional passion is tying together the pieces of a fundraising shop and leveraging data to make things run smoothly. She credits her start in her profession with a colleague who encouraged her to “figure it out” on a homegrown Paradox database. As an technologist, Carrie deeply values the “can-do spirit” of initiative and discernment in her everyday work – she challenges her staff to “think and try” and believes her success is rooted in those qualities.
A Cincinnati native and graduate of the University of Alabama at Birmingham, Carrie previously worked with the UC Health Foundation, the Urban League of Greater Cincinnati, Jacobson Consulting Applications, the Cincinnati Museum Center, and the Birmingham Zoo. Carrie lives with her husband and two children in the Cincinnati area.

Betsy Schmidt-Gullett
Betsy Schmidt-Gullett has served as the Senior Director of Prospect Development at The University of Cincinnati Foundation since 2019. She also enjoys her roles on the OPRN (Ohio Chapter of APRA) Board as Membership Coordinator and as a part of the Great Lakes FORUM. Prior to that she held various roles at The Ohio State University, including leading their prospect identification efforts and prospect development data integrity, Associate Director of Prospect Research, and as a Prospect Research Analyst for The Wexner Medical Center. Betsy began her career in Advancement at her alma mater, Wittenberg University, where she was the Associate Director of Prospect Research and Prospect Management. She has also worked as an International Student Advisor and HR Generalist. She earned a Bachelor of Arts in English from Wittenberg University and is happy to have returned to her Cincinnati roots with her three children.

Aubrey Wilson
Aubrey Wilson is the Director of Reporting & Analytics for The University of Cincinnati Foundation, having joined the organization in 2018. She has held various roles in data and event management for both tech and non-profit organizations, including serving on the board for Cincinnati Pride helping to plan and run the annual Parade and Festival and growing the parade to one of the largest in Cincinnati, as well as spending five years as a database and incident manager at an MSP in Southeastern Ohio. She has a passion for data and making that data accessible and usable by everyone through visualizations and insights. In addition to being a data junkie, she is also active in the Cincinnati theatre community and serves on the board of Cincinnati Music Theatre. A graduate of Eastern Kentucky University, she currently lives in Northern Kentucky with her partner, their westie, and their one-year-old son.