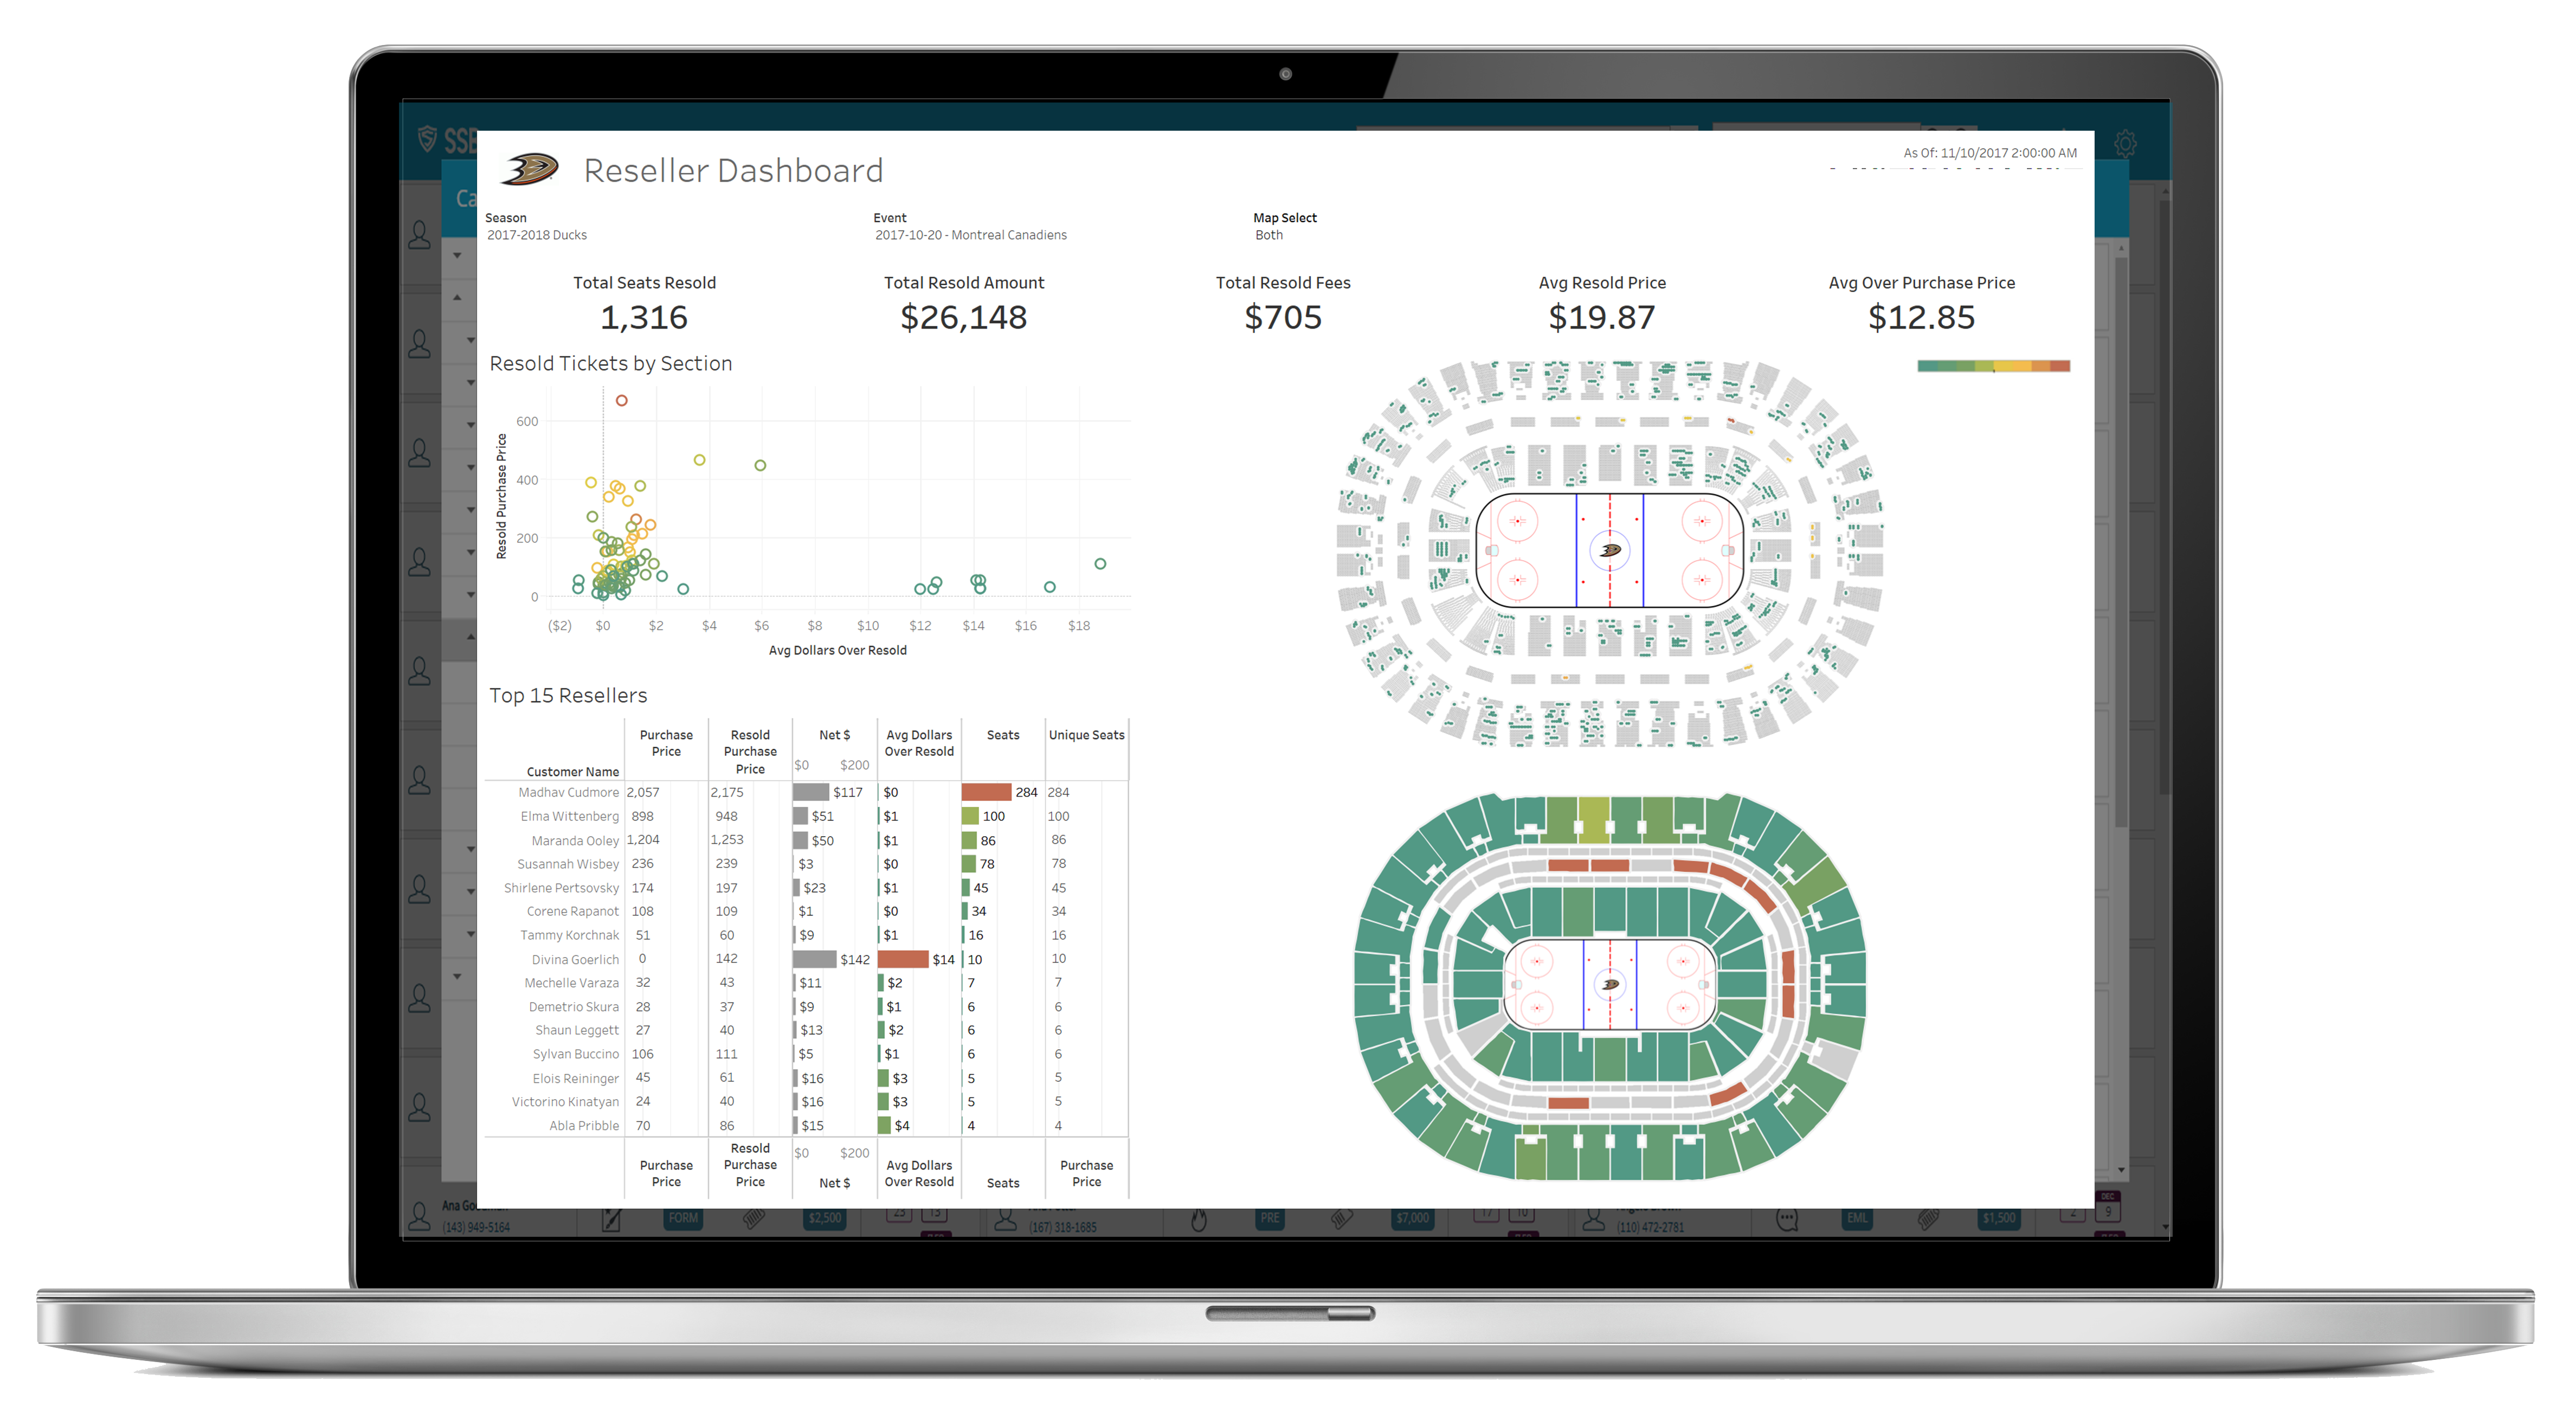
After this introductory workshop, you will have the confidence to build visualizations that you and key stakeholders can use to make proactive, actionable decisions for your organization.

This introductory session includes
- Connecting to a data source
- How to create different visualizations
- Bar graphs and line charts
- Filtering and dropdowns
- Changing visualization types
- Calculations
- Best-practices
- Live vs. extract
- Naming conventions
- Default colors and values


