
A critical element of any successful advancement or fundraising program is the ability to pinpoint prospective donors and volunteers. Traditional methods of prospect identification are clunky, overwhelming, and frequently miss potential first-time volunteers and donors, often limiting prospects to a pool of already-known individuals.
After struggling with these challenges, the advancement team at Carnegie Mellon University has found a better way to identify and target potential volunteers and donors through predictive analytics. The team makes these insights readily available to frontline staff by integrating them into Advancement RM, their Salesforce-driven CRM of choice.
In May, CMU’s Michael C. Calhoun and Muza Furin-Carraux joined Affinaquest in a case study webinar to share their knowledge and experience with this project. You can access the full webinar, which contains all of Mike and Muza’s technical details, by clicking the button below. For a written recap of Mike and Muza’s excellent presentation, read on.
How CMU Used Predictive Analytics to Identify Potential Donors and Volunteers
Meet the Presenters

Michael C. Calhoun

Muza Furin-Carraux
Executive Summary: How does a business need turn into Salesforce success?
Business Needs/Objectives
Carnegie Mellon’s advancement staff aimed to better identify potential donors and volunteers to deepen engagement and maximize fundraising at the university.
Statistical Methods
The CMU team employed a logistic regression model, analyzing variables identified by frontline staff to identify predictive giving and volunteer patterns. They built the model in Python, a free statistical analysis program.
Advancement RM & Salesforce Integration
Custom objects and Apex code were leveraged to translate the predictive model’s calculations to Advancement RM, a robust CRM built on Salesforce. Results are displayed in reports and dashboards, built in Tableau and accessible to the annual giving team and other advancement staff.
Building a Model to Identify Donors and Volunteers at Carnegie Mellon University
“Predictive modeling is a mathematical process used to predict future events or outcomes by analyzing patterns in a given set of data,” Muza Furin-Carraux explained to the webinar audience.
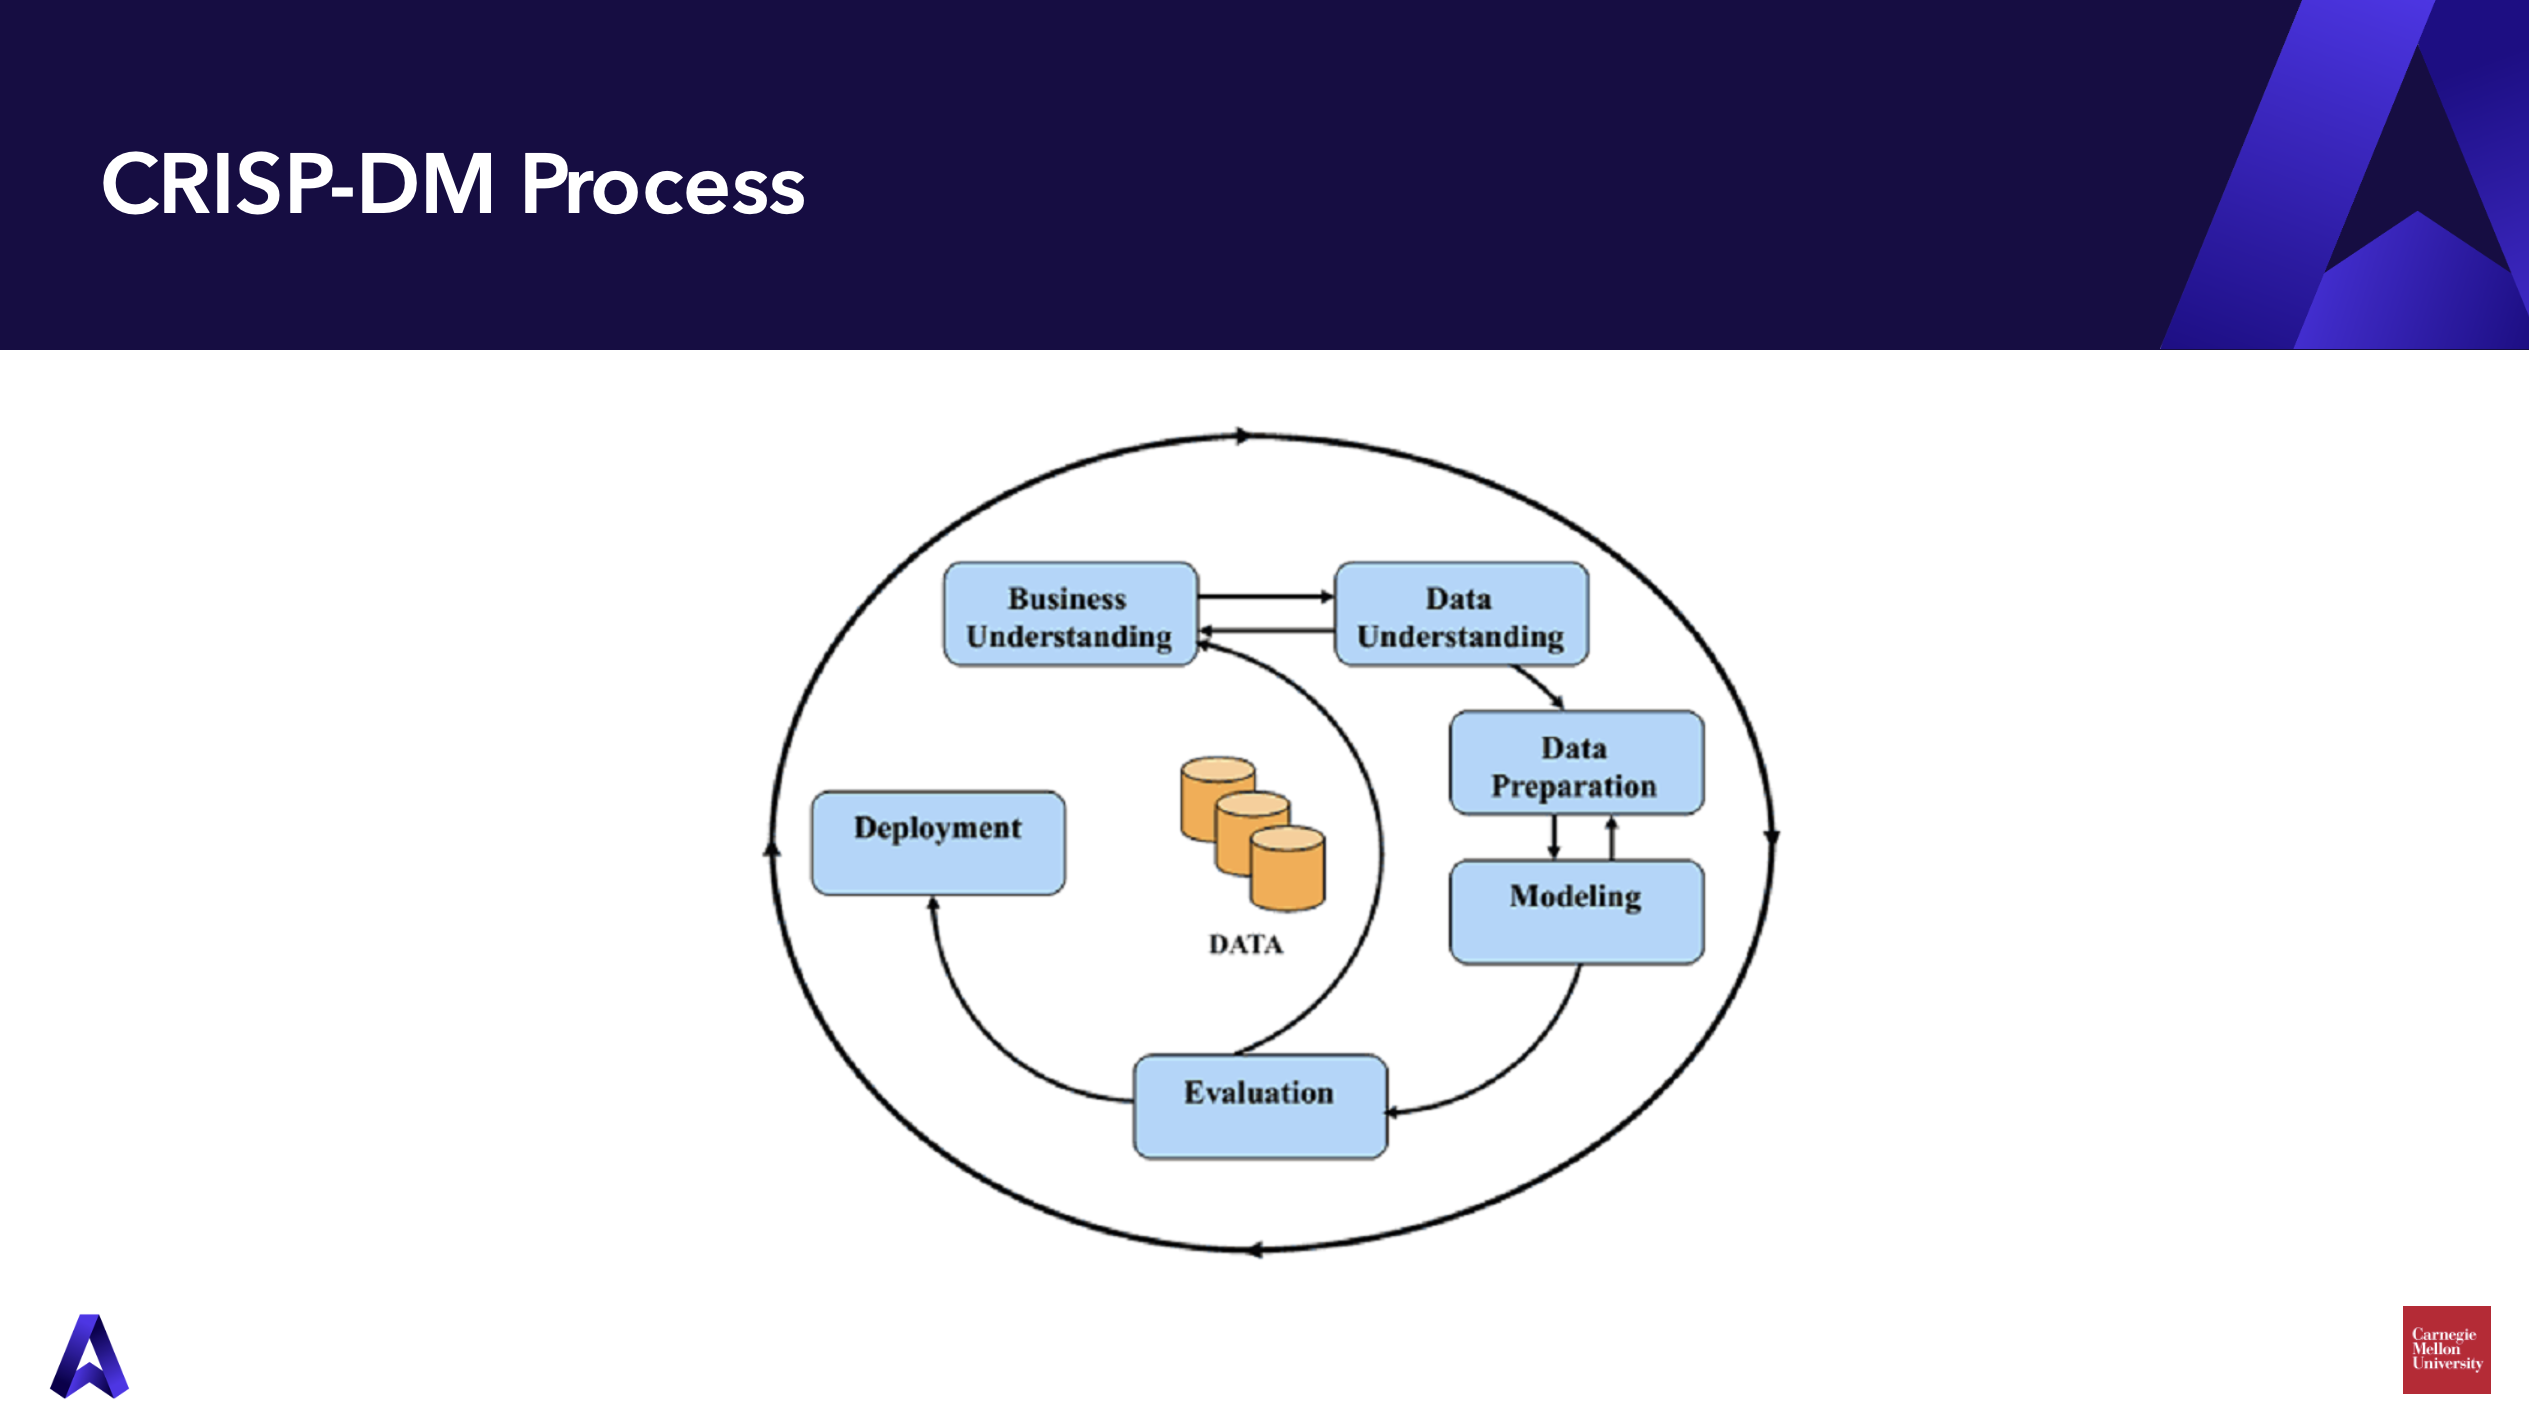
Muza led the statistical analysis for the project, following the CRISP-DM process. The term CRISP-DM stands for cross-industry standard process for data mining and includes six phases:
- Business Understanding: defining the business or organizational problem and designing an analytical solution to fit.
- Data Understanding: identifying, exploring, and curating relevant data sources.
- Data Preparation: cleaning and formatting the selected data.
- Modeling: selecting, developing, training, and testing a statistical model based on the selected data.
- Evaluation: assessing the model’s output and interpreting the results.
- Deployment: presenting and utilizing the model’s predictions.
These six phases are illustrated in the image below.
At Carnegie Mellon, conversations with the Annual Giving team helped Muza understand the need (more effective prospect identification for annual giving), define a project goal (using machine learning techniques to identify potential donors and volunteers), and pick out essential data for the analysis. As subject matter experts, the observations, best guesses, and anecdotes shared by CMU’s annual giving and alumni staff pointed to many variables included in the model.
Of the many data science methods available for prediction, Muza’s team determined that logistic regression was best suited to this particular project. Logistic regression is a common statistical model that results in a binary outcome, such as donor or non-donor.
All alumni (both undergraduate and graduate) were included in the analysis, which focused specifically on annual gifts. However, Muza noted that donation and volunteer history were not considered in models that predicted donors and volunteers, respectively. Excluding that data allowed CMU to see how other factors, such as biographic and demographic variables, correlated with these behaviors, helping to identify prospects beyond the volunteers and donors already engaged with the institution.
The model was built in Python, an open-source statistical analysis package. Similar models could be developed in SPSS, SAS, R, and other programs. Muza then assessed the model’s validity and performance and examined the results displayed below.
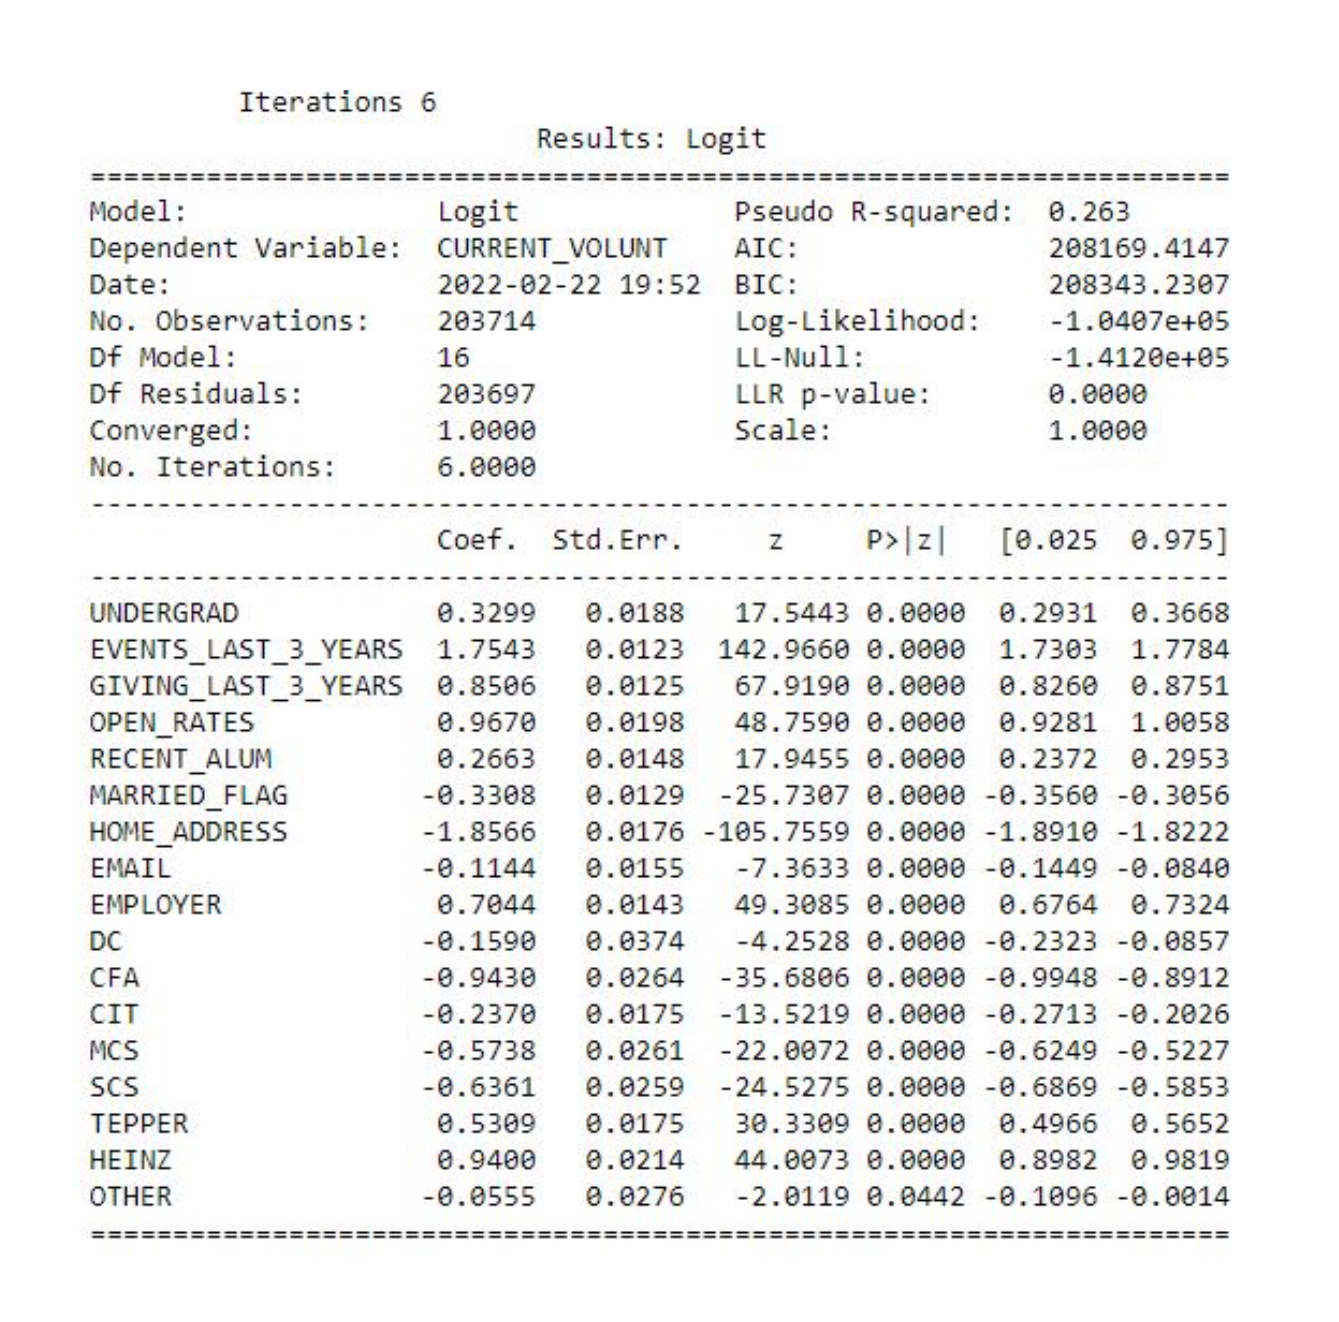
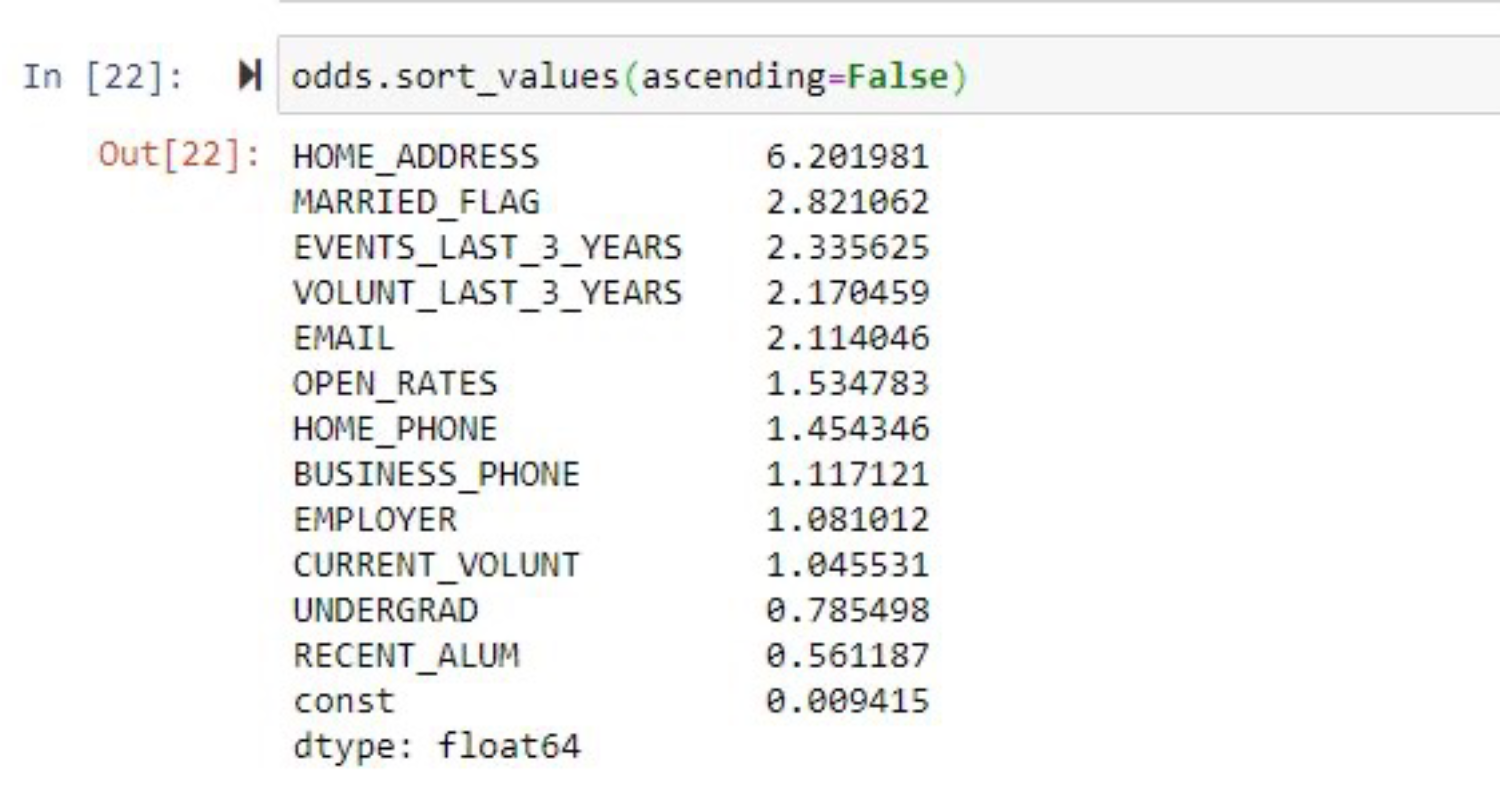
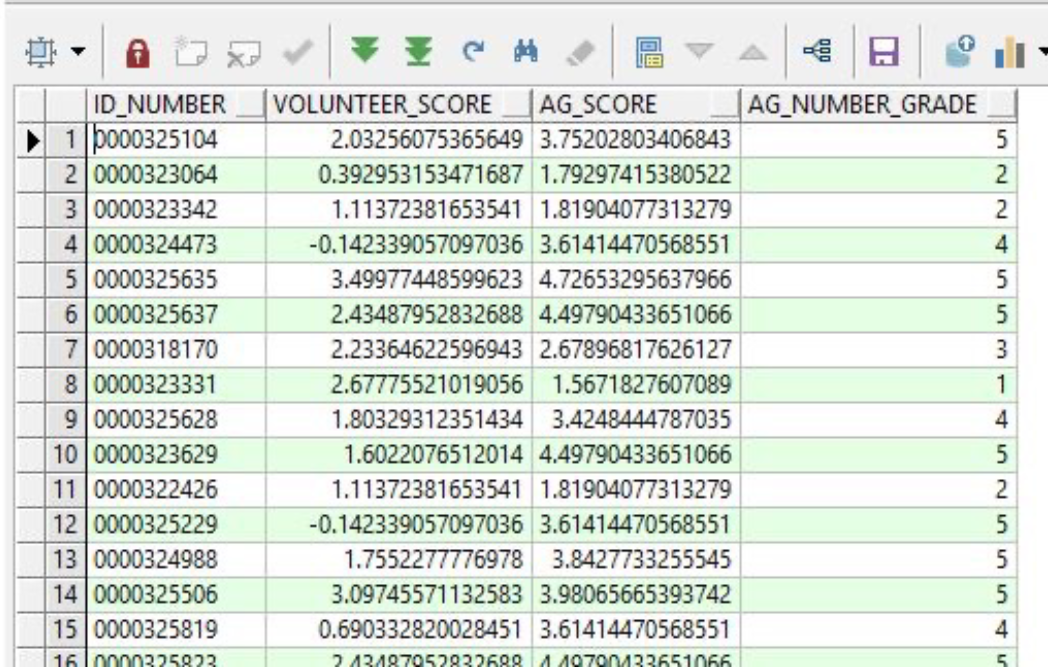
In a statistical model, significant variables are found to have an impact on the defined outcome, raising or lowering the likelihood that an individual achieves that outcome. The amount of each variable’s influence is described as a coefficient value or odds ratio. At CMU, those ratios were tallied to calculate an individual’s likelihood to make an annual gift or volunteer. With those calculations, which Muza called annual giving and volunteer scores, CMU had unlocked a smarter, more data-driven approach to prospect identification.
As a final step, Muza translated the numerical output into letter grades of A through E, with A representing a high likelihood of becoming a donor or volunteer. This simplification presents frontline fundraising and engagement officers with a clear, easy-to-interpret version of the scores.
Advancement RM & Salesforce Integration
As Affinaquest clients, Carnegie Mellon uses Advancement RM, built on the Salesforce platform, for their advancement program. CMU’s Mike Calhoun noted that this process could be replicated across many CRM platforms.
To track the significant variables from Muza’s model, Mike built a custom object (Salesforce terminology for a table within the database) within Advancement RM that he called the Giving Scores Object. It includes data such as:
- What school or college the individual is associated with;
- Whether they have received and opened communications;
- If they attended CMU as an undergraduate student; and
- Whether they are currently employed.
Each field contains a checkbox representing yes when checked (ex. associated with the Tepper School of Business) or no when unchecked. This simple presentation, as seen in the image below, draws on more detailed data contained within the contact (individual) record.
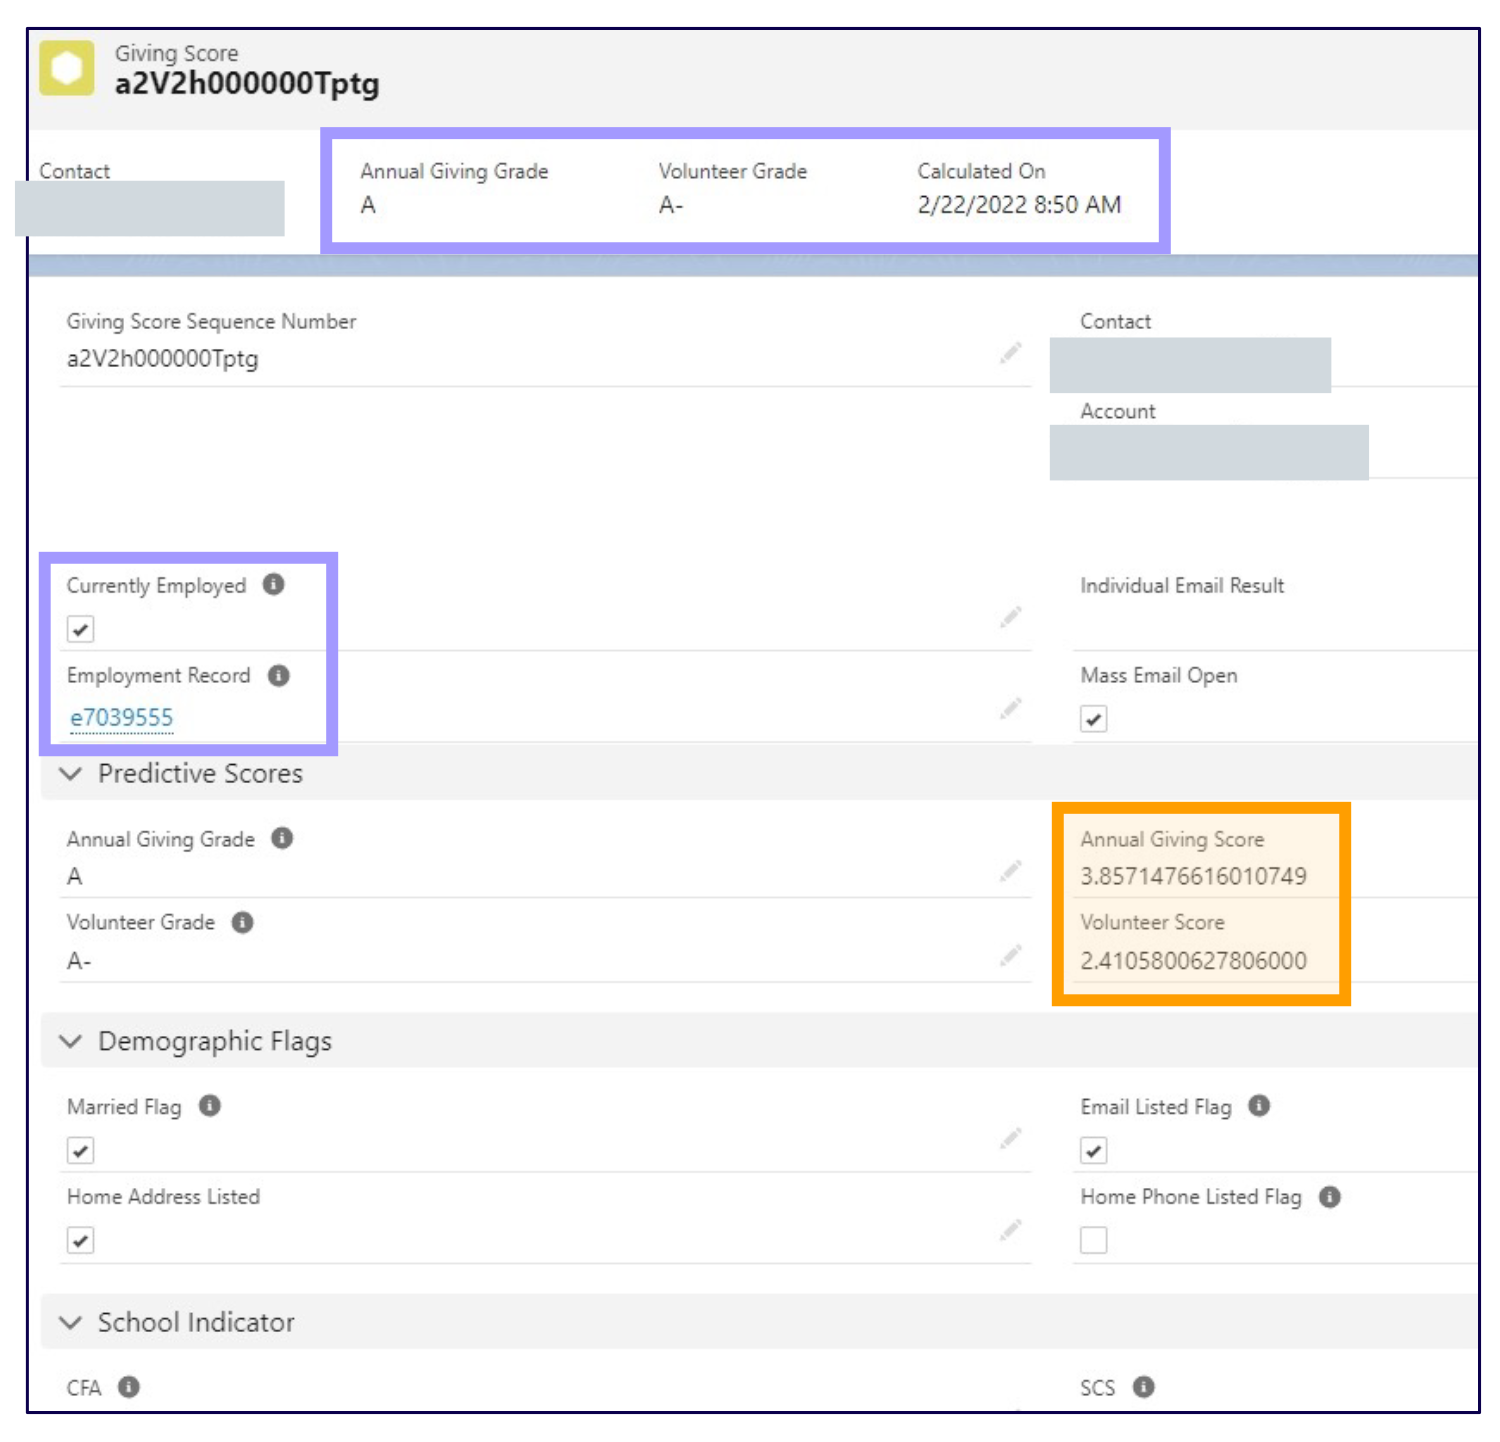
“All we do is gather up all the variables that Muza talked about. Is a person this, is a person that?” Mike explained.
Also included in the object are annual giving and volunteer scores in both numerical and letter forms. “That’s the keystone of this particular object,” Mike said, noting that the scores tie all of the variable fields together.
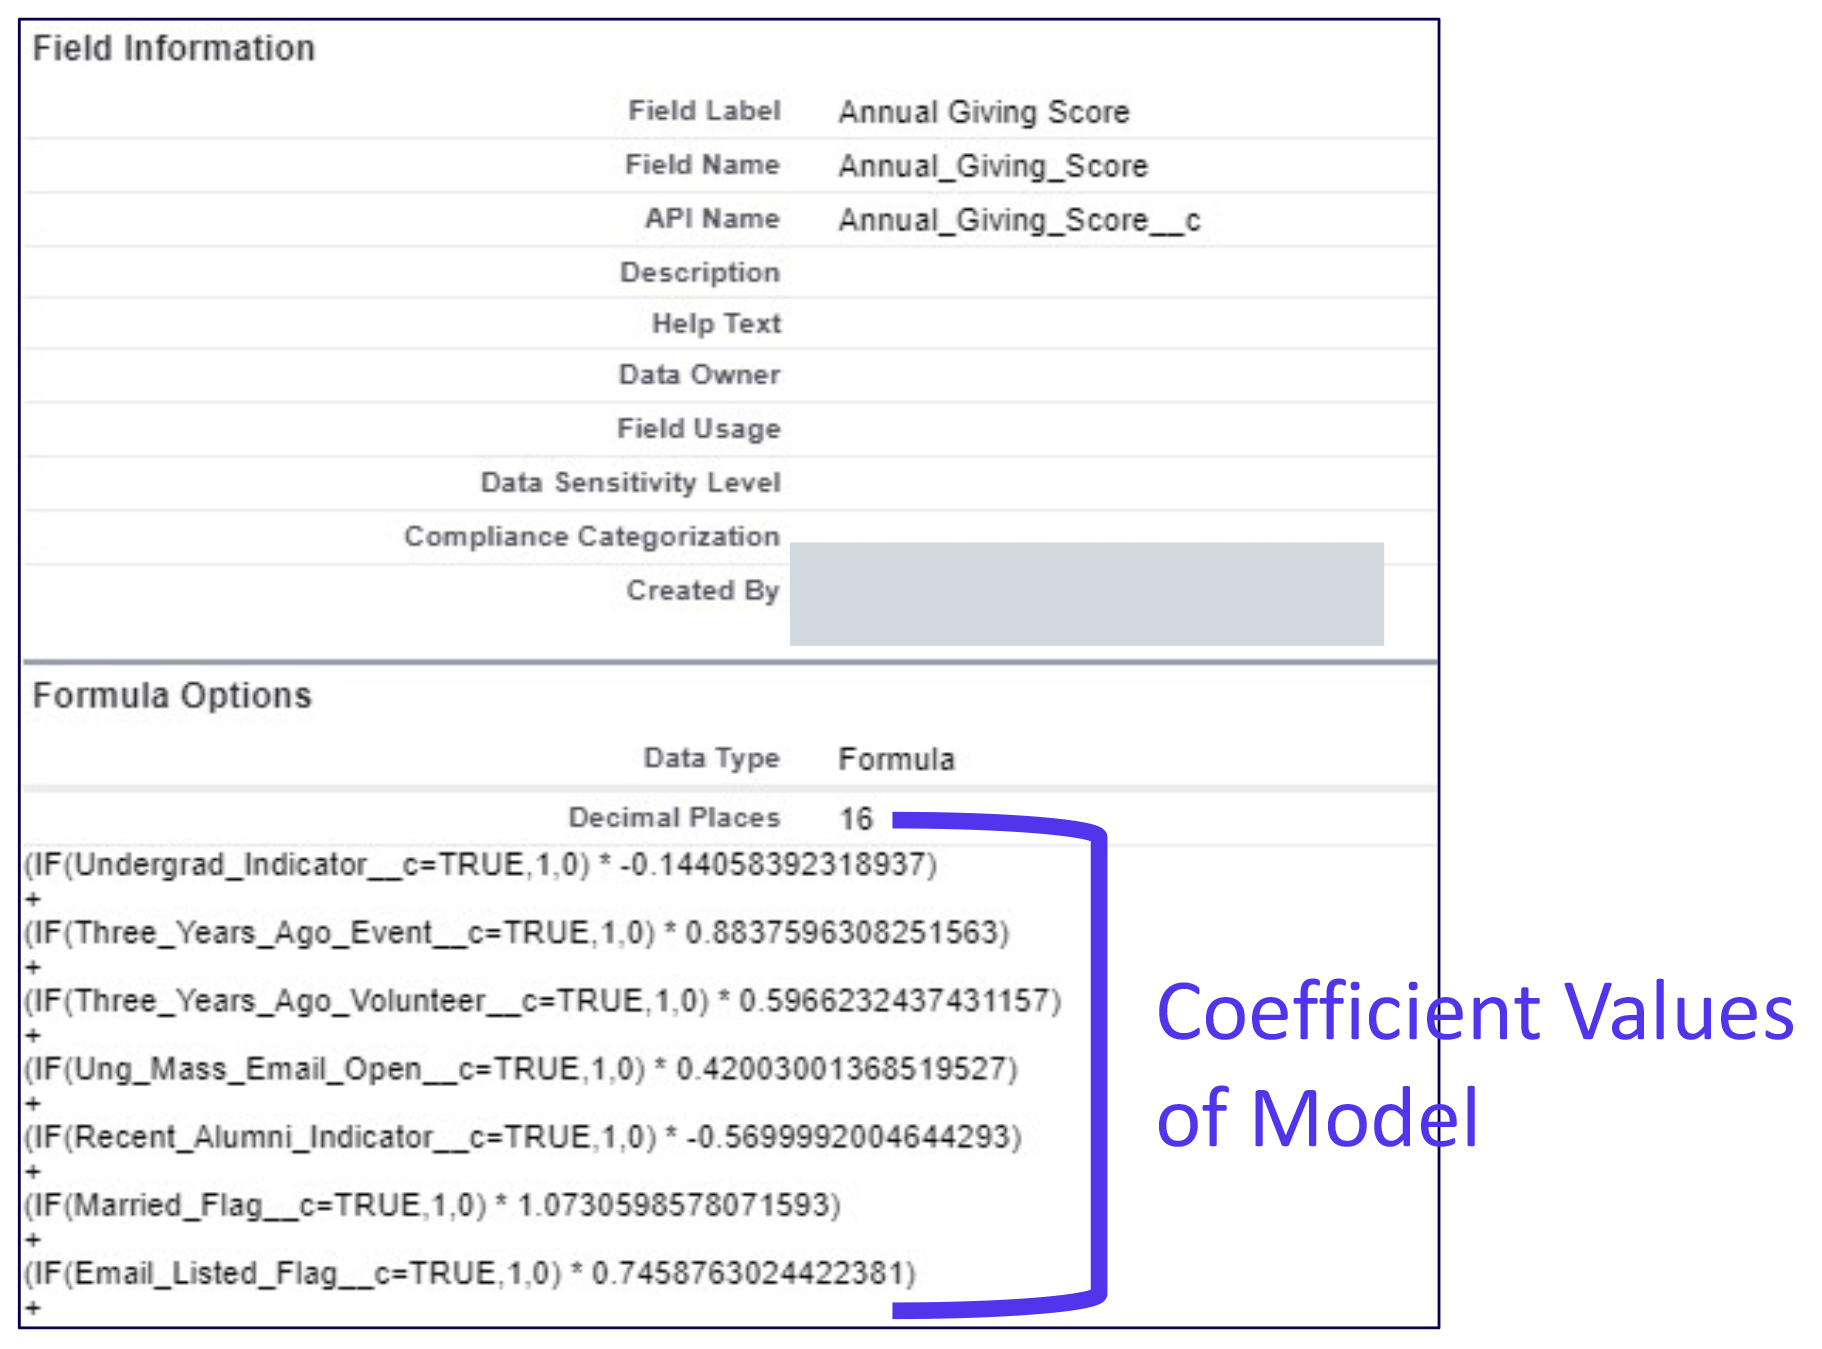
Using a formula, the annual giving and volunteer score fields each contain a series of “if, then” statements (if an individual is employed, then…) to identify the variables checked as “yes” for the individual and apply the corresponding coefficient. These conditional calculations, shown in the below image, add up together to produce a total score based on current data.
Running and Updating the Giving and Volunteer Scores
One benefit of integrating predictive analytics calculations into an advancement CRM is that those predictions become as dynamic as the database itself.
At CMU, Apex code, a Java-based programming language used in Salesforce helps to maintain the calculation fields. This means that no external or manual review is required to update giving and volunteer scores in response to changing data.
The scoring utility runs overnight, processing 200 records at a time. A Giving Scores Object record is created and populated based on the current contact data, then the annual giving and volunteer scores are produced accordingly.
This functionality extends the predictive power of Muza’s model far beyond the original dataset and a static prediction. Scores can be calculated for new alumni and updated for others as the data changes, offering up-to-date insights that fundraisers can trust.
Why are Predictive Analytics Useful in Advancement RM?
Adding predictive data to the CRM also makes key insights available to advancement, empowering team members to take action.
While the Giving Score Page presents the scores and data for an individual, annual giving and volunteer score data is also presented in reports and visualizations. Mike shared a few examples of this aggregate functionality.
Recent Graduates in the Pittsburgh Area with High Predictive Scores
This example report shared by the CMU team identifies individuals who:
- Have an address in the Pittsburgh area;
- Graduated within the last 10-12 years, based on a “pref year” or preferred graduation year of 2010 or later; and
- Have a giving score of A or above.
A report like this is beneficial for advancement staff working in a particular geographic area. From the report, they can identify groups or individuals to target and drill down into each contact record for more information.
Example Dashboards: Annual Giving Scores by School or College
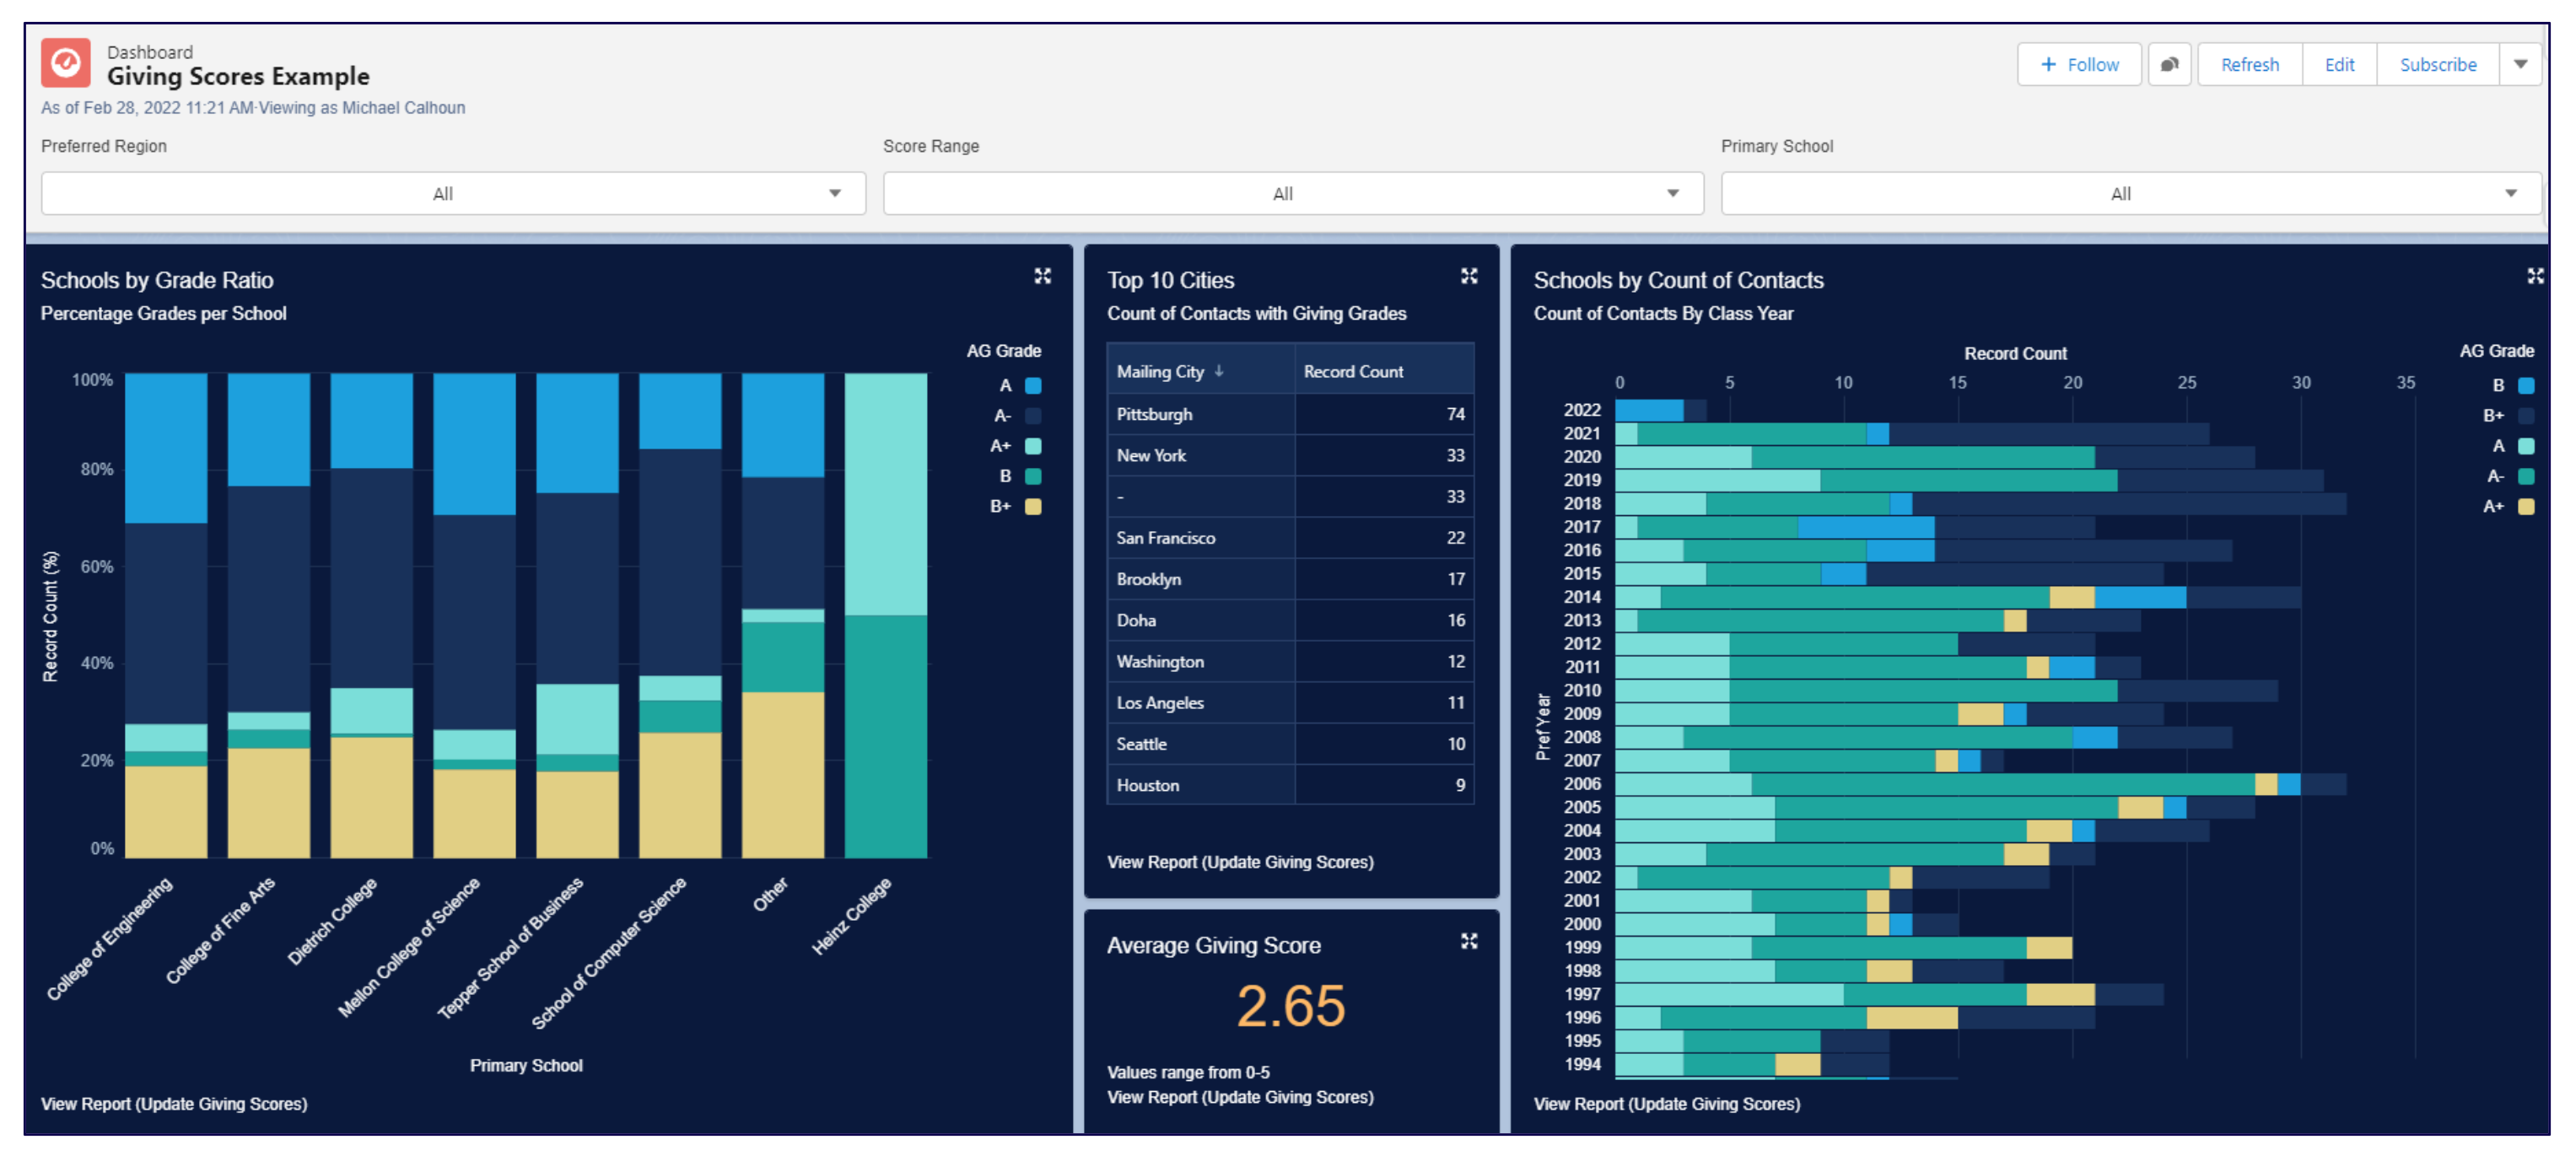
Visualizations are a great way to present high-level insight quickly. Tableau, a popular data visualization tool, is available to Advancement RM users as part of Salesforce’s suite of products. Built in Tableau, one of CMU’s visual dashboards shows how annual giving scores vary across the university, with data grouped by school or college.
Using built-in filters, Mike narrowed the same data to only show the Tepper School of Business.
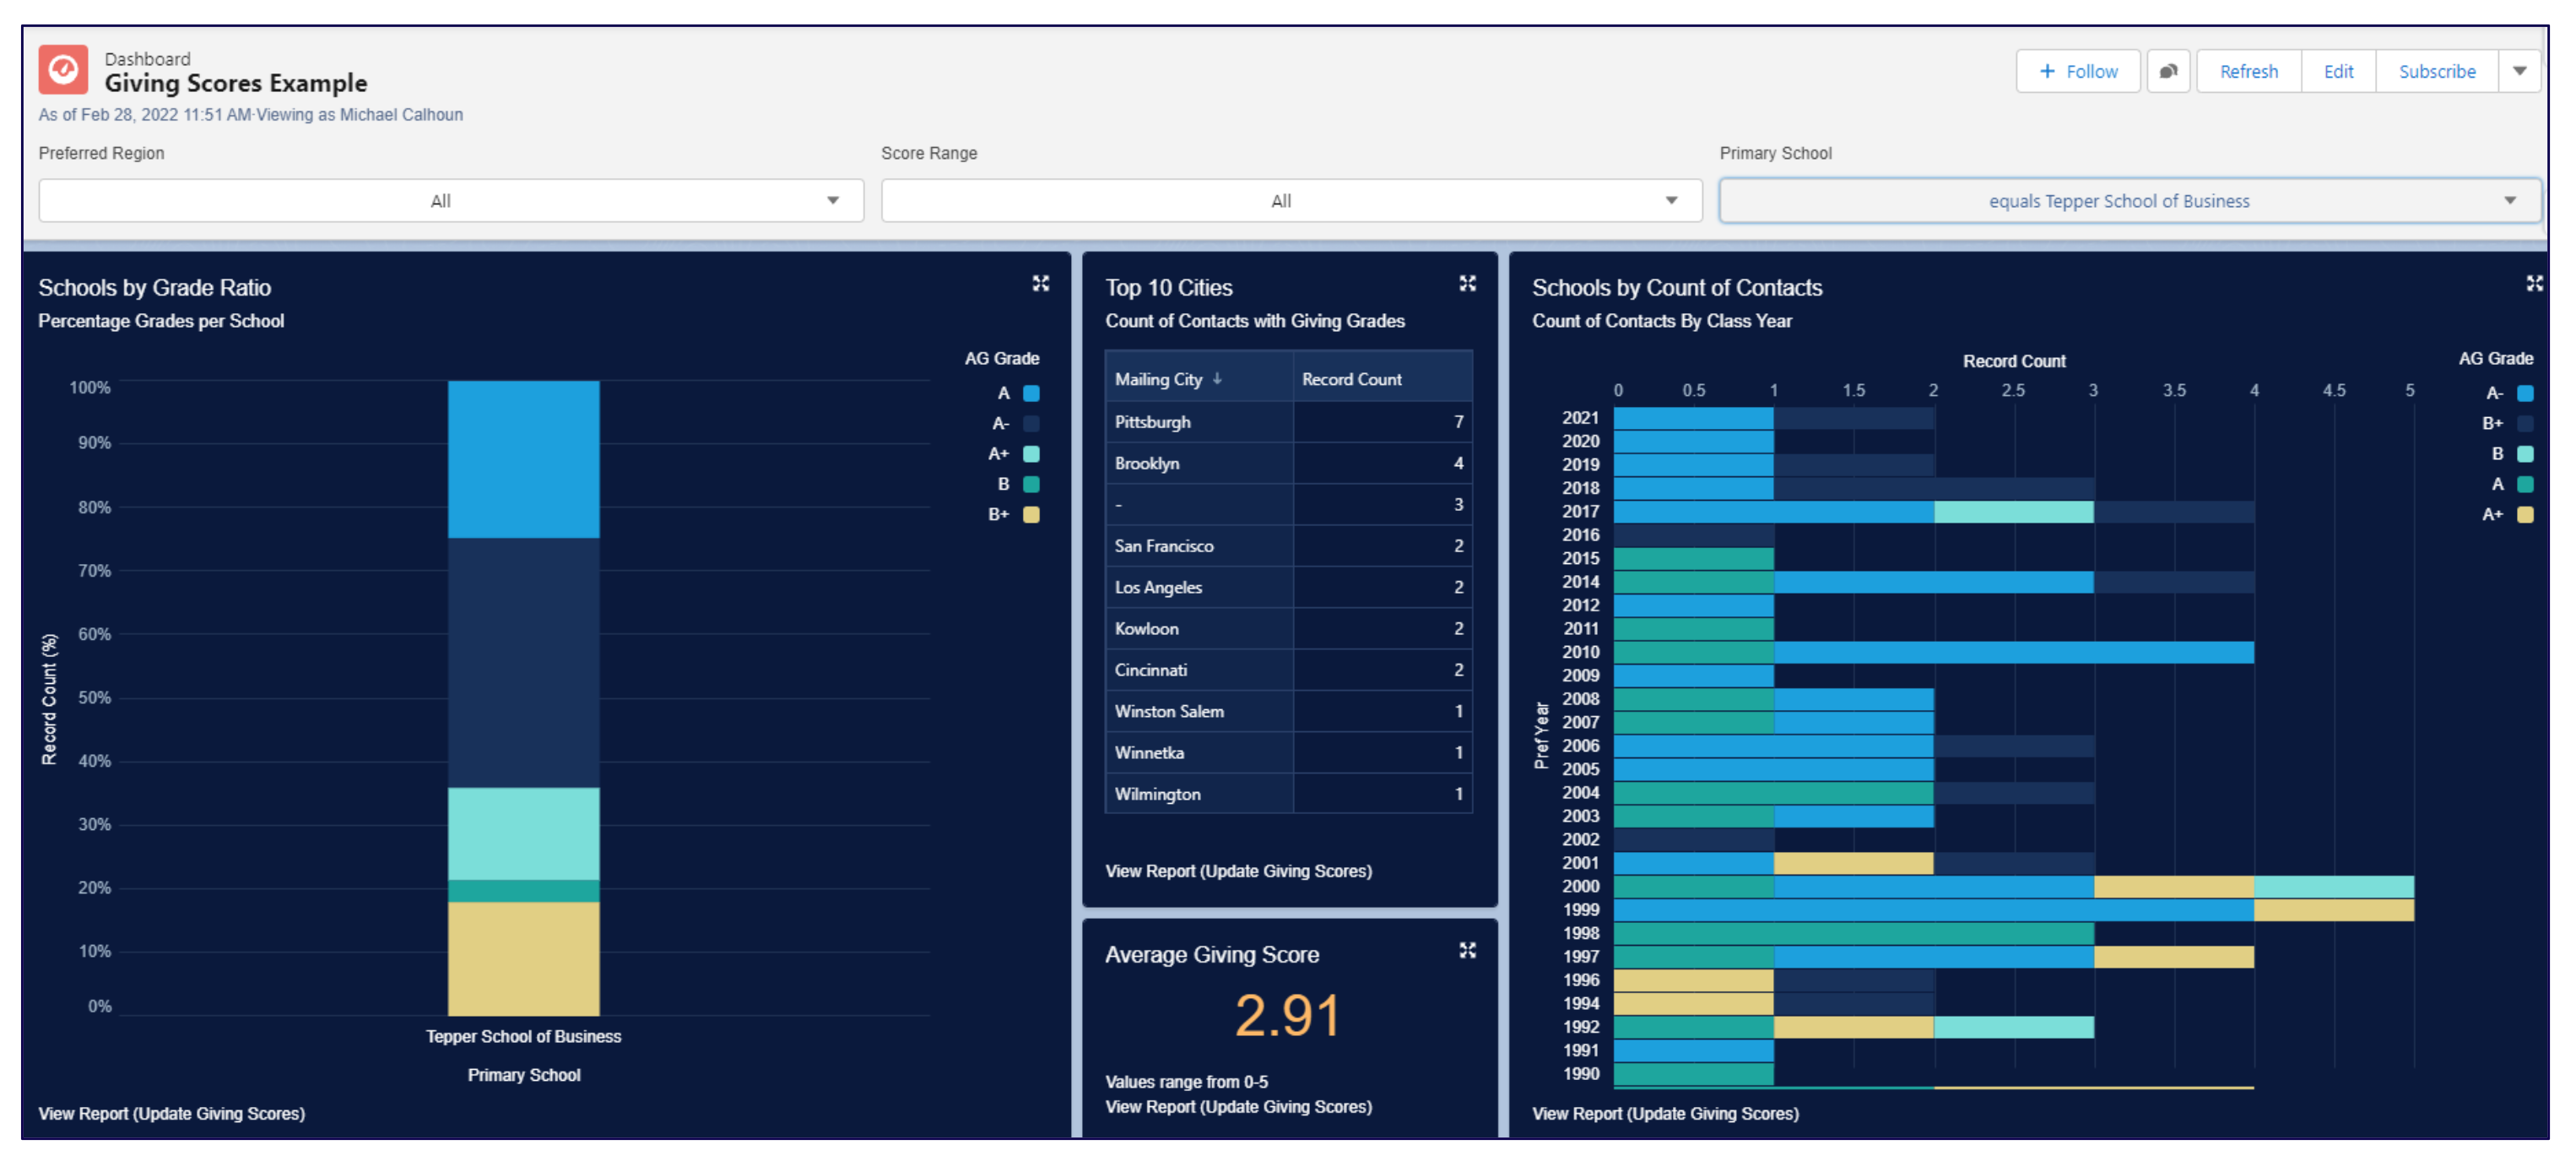
In this single-college view, the average giving score jumped from 2.65 to 2.91, indicating that Tepper grads are more likely to become annual givers than the average CMU alum. Advancement and college staff could leverage that information strategically, designing their efforts with this in mind.
Impact
After deploying the into Advancement RM, the Carnegie Mellon team requested feedback from the Annual Giving team. Their responses were positive, proving the project’s success:
“I use the volunteer scoring model on a yearly basis when recruiting alumni to support the reunion programming efforts. The scoring model report provides me with another method for targeting alumni to serve in a volunteer role for their reunions.”
“I do find it useful and believe I have seen success in pulling in alumni for a volunteer role.”
“As we are recruiting for reunion engagement and giving volunteers, we extend invitations to those with a high volunteer score.”
Implementing Predictive Analytics At Your Institution
For institutions struggling to prioritize predictive analytics for advancement, Mike offered some encouragement: “One would think that predictive analytics is too far up on Maslow’s data hierarchy of needs,” he said. “But you can get actual insight that your teammates on the front line can use right away to start pushing the needle forward.”
Of course, these insights are often only as good as an advancement team’s access to them. If an institution’s CRM can’t integrate predictive analytics directly into its interface, his advice is clear: “You might want to consider a new CRM.”
To learn more about Advancement RM, predictive analytics, and other data tools to help your institution achieve similar results, contact Affinaquest’s team of data experts today.